> For the complete documentation index, see [llms.txt](https://docs.jcore.io/clarity/llms.txt). Markdown versions of documentation pages are available by appending `.md` to page URLs; this page is available as [Markdown](https://docs.jcore.io/clarity/reports/recurring-reports.md).
# Recurring Reports
(Continued from [Creating a Report](/clarity/reports/create-report.md))
Make sure **Enabled** is turned on. You can turn off the **Enabled** switch if you want to pause sending reports, but keep the report settings for later.
Configure the when the report will recur using these fields:
There are four options for the recurrence interval:
| .png?alt=media) | .png?alt=media) |
| :-----------------------------------------------------------------------------------------------------------------------------------------------------------------------------------------------------------------------------------------------------: | :-----------------------------------------------------------------------------------------------------------------------------------------------------------------------------------------------------------------------------------------------------: |
| .png?alt=media) | .png?alt=media) |
The **Report Generation Time** and times in the CSV output will be determined according to the **Time Zone** you select here:
The **Data Interval** controls the amount of time between individual data points in the report. For example with a Data Interval of **1 hour**, each row of the report will summarize one hour of historical data:
And you can select whether to include the **Average**, **Min**, and/or **Max** tag values for each data interval in the report:
It's possible that the recurrence interval, data interval, aggregations, and tags you've selected would make the report too large. If so, you'll see this error:
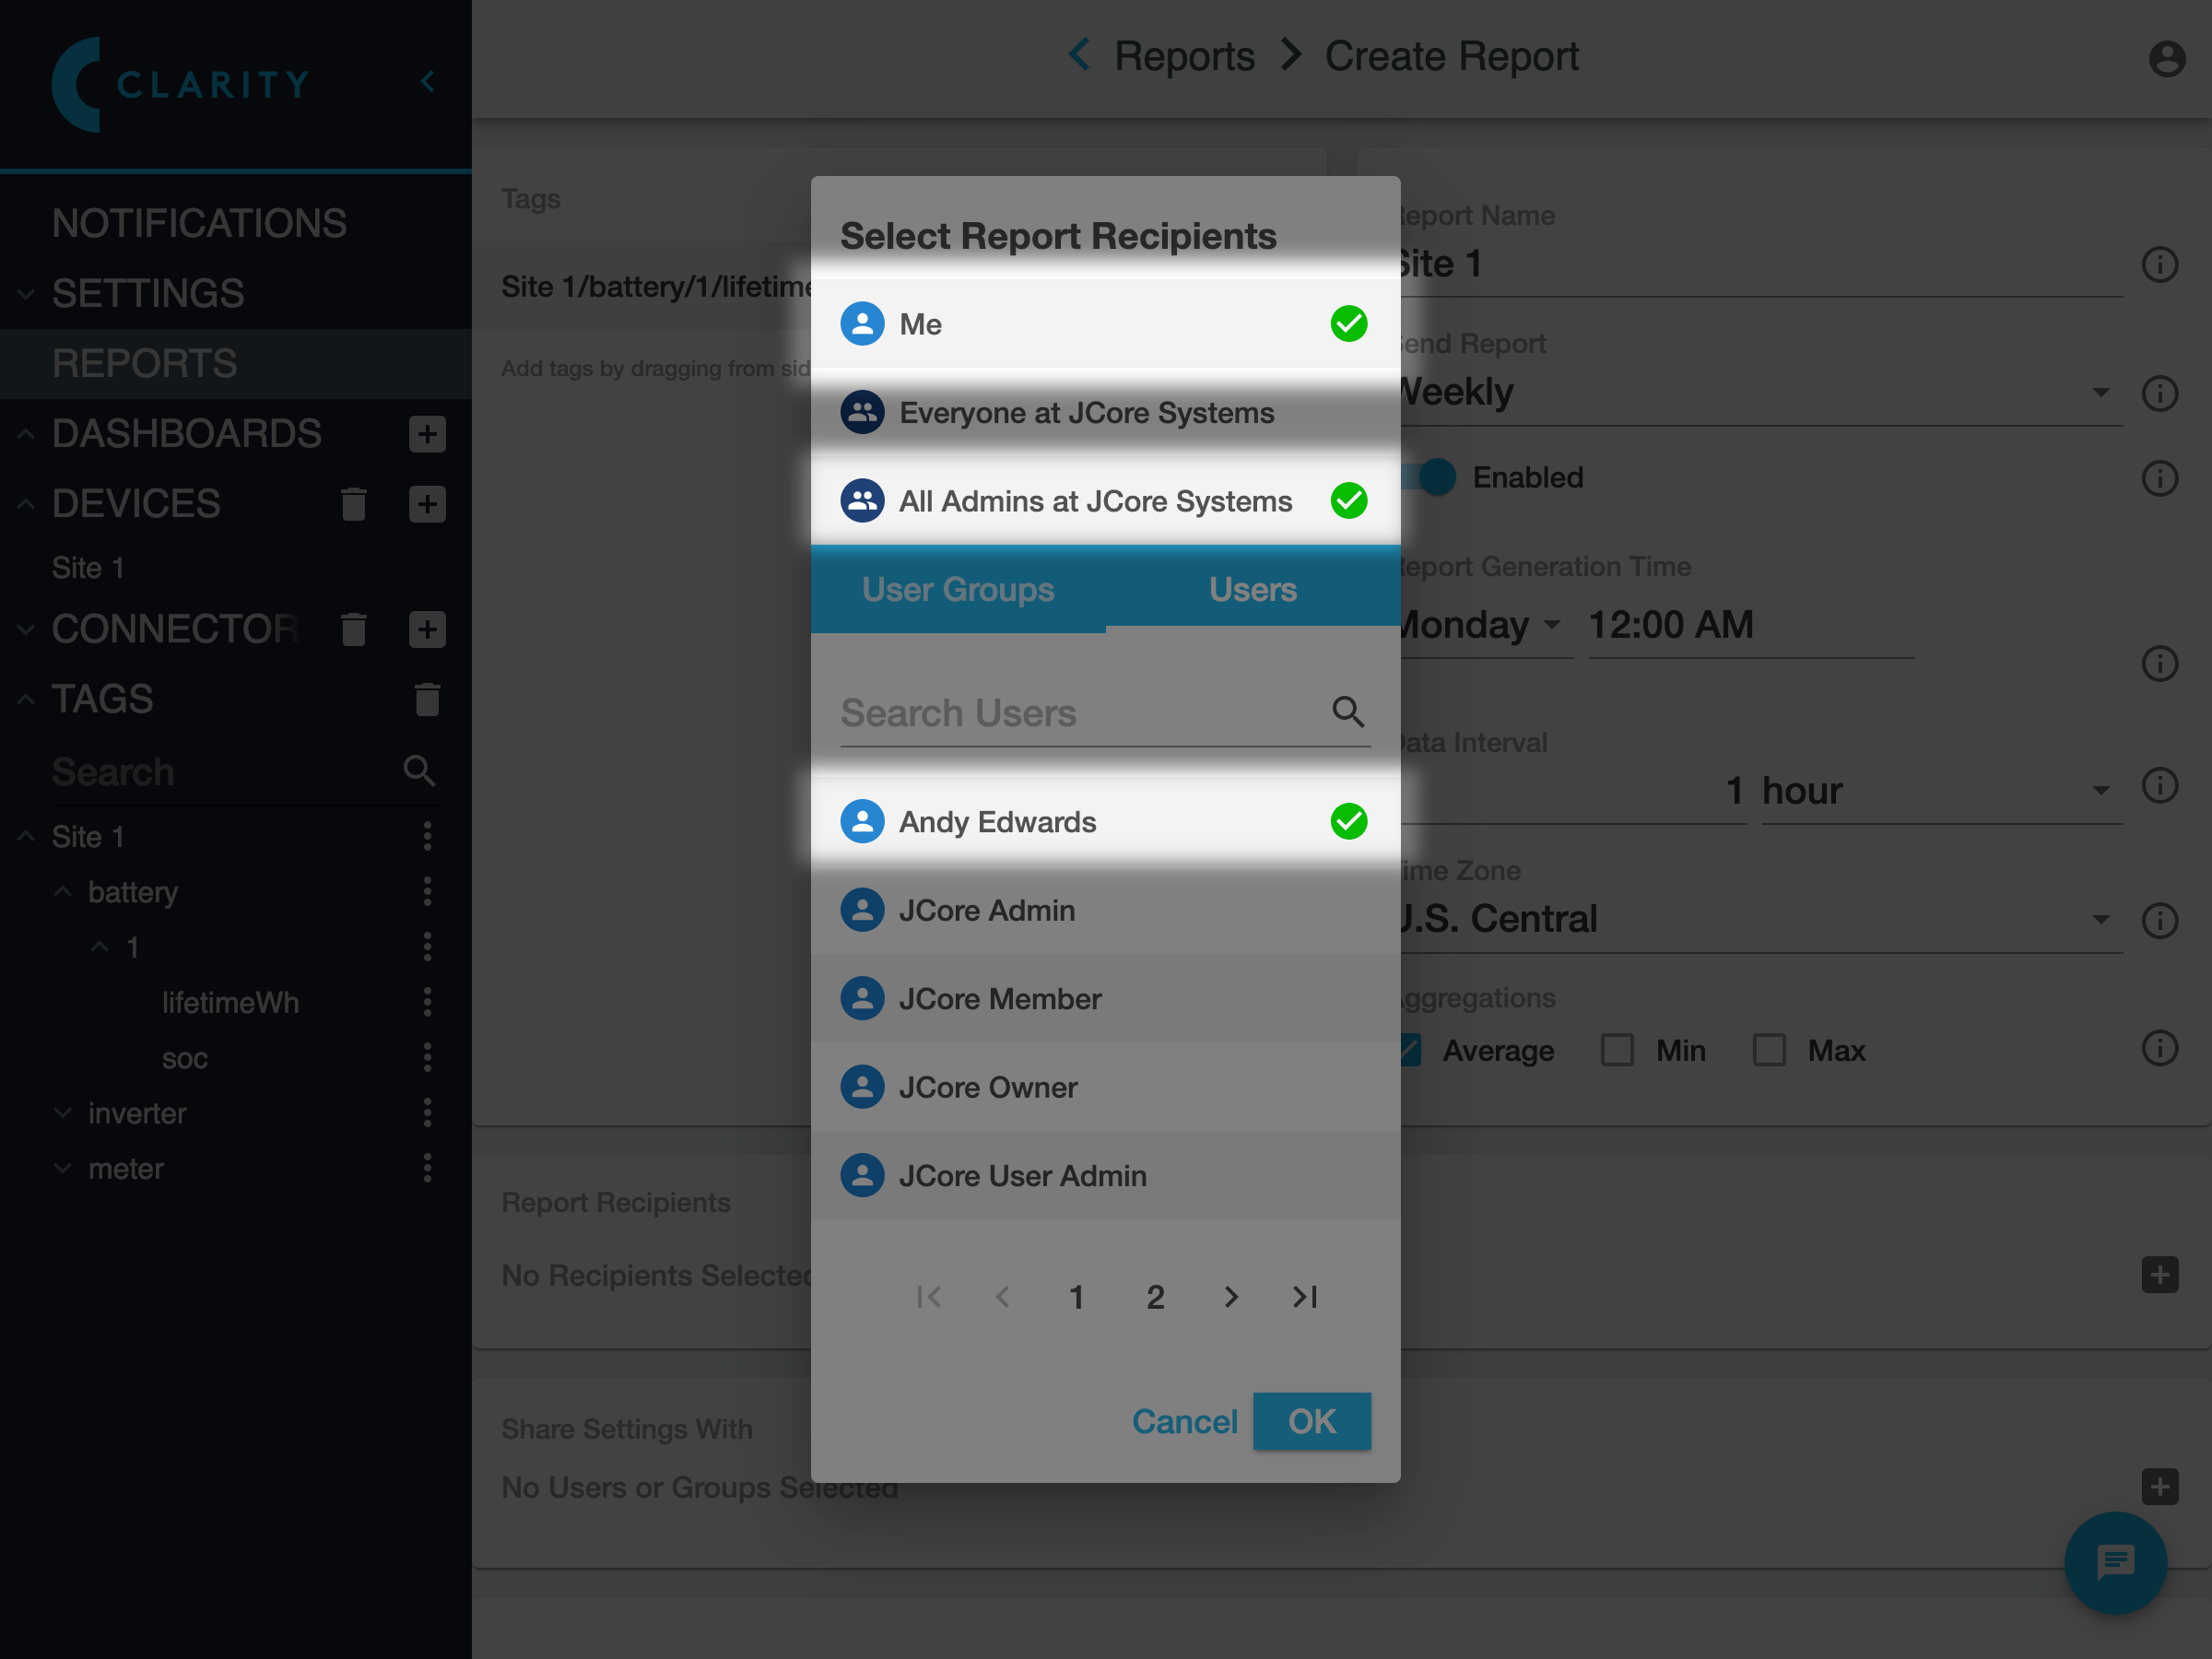
To select email recipients, click the **+** button in the **Report Recipients** panel:
Then in the dialog that appears, check all the users and groups you want to receive emails:
After you click **OK** you should see the selected users and groups in the **Report Recipients** panel:
To download a sample of what the CSV report will look like, click **Download Sample** at the bottom of the form:
Finally, click **Save Settings** at the bottom of the page to create the report:
###
.png?alt=media)
.png?alt=media)
.png?alt=media)
.png?alt=media)
.png?alt=media)
%20(1).png?alt=media)
.png?alt=media)
.png?alt=media)
.png?alt=media)
.png?alt=media)